Why conversion rates decide whether your online store actually makes sales
Launching an online store is exciting. The first few days usually feel full of hope. You upload products, share the link with friends, maybe run a few ads, and then start checking the dashboard.
Visitors are coming.
But orders are not.
This is one of the most common frustrations new ecommerce sellers face. You see people visiting your website, sometimes even browsing multiple pages, but they leave without buying anything.
This is where conversion rates become important.
Understanding conversion rates helps you answer a simple but powerful question:
Why are visitors not becoming customers?
Instead of guessing, you can use simple analytics to understand what people are doing on your store and improve your chances of making a sale.
Let us break this down in simple terms.
What conversion rate actually means
In ecommerce, conversion rate simply means the percentage of visitors who complete an action on your website.
Most of the time, this action is making a purchase.
The formula is simple.
Conversion rate =
(number of orders ÷ number of visitors) × 100
For example:
If your store gets 100 visitors and 5 people buy something, your conversion rate is:
5 ÷ 100 × 100 = 5 percent
That means 5 percent of visitors became customers.
This number helps you understand how effectively your website turns visitors into buyers.
What is considered a good conversion rate
Many new sellers ask the same question.
“What is a good conversion rate?”
The answer depends on the industry and type of product.
However, several studies give us useful benchmarks.
According to Shopify ecommerce benchmark data (2024), the average ecommerce conversion rate globally falls between 2 percent and 3 percent.
Another study by IRP Commerce (2023) found that top-performing ecommerce stores can reach 5 percent or higher.
So in practical terms:
1 percent conversion rate
means your store is struggling.
2 to 3 percent
is a normal ecommerce range.
4 to 5 percent
is considered very good.
More than 5 percent
usually means the store experience is working extremely well.
For a new seller in India, even reaching 2 percent is a good start.
Why many ecommerce stores struggle with conversions
Getting visitors is one challenge.
But convincing them to buy is a different challenge altogether.
Many new sellers assume the problem is traffic.
But often, the real issue lies inside the website itself.
For example, imagine a visitor searching:
“cotton bedsheet king size”
They click your website.
But when they land on the page:
- the images are unclear
- the price is not visible immediately
- delivery information is missing
- the website loads slowly
Within seconds, they leave.
This behaviour is extremely common.
According to Google consumer insights research (2023), 53 percent of users leave a mobile site if it takes longer than 3 seconds to load.
This means even small issues can hurt conversion rates.
How simple analytics helps you understand visitors
Analytics tools show you what visitors are actually doing on your website.
Think of it like observing customers inside a physical shop.
In a real store, you can see:
- where people walk
- what products they pick up
- when they leave the shop
Online analytics does the same thing.
Tools like Google Analytics track behaviour such as:
- how many people visit your store
- which pages they view
- how long they stay
- where they leave the website
This information helps you understand where customers lose interest.
Understanding the customer journey on your website
Every ecommerce visitor follows a journey.
It usually looks like this:
- They discover your store
- They open a product page
- They consider the product
- They add it to cart
- They complete checkout
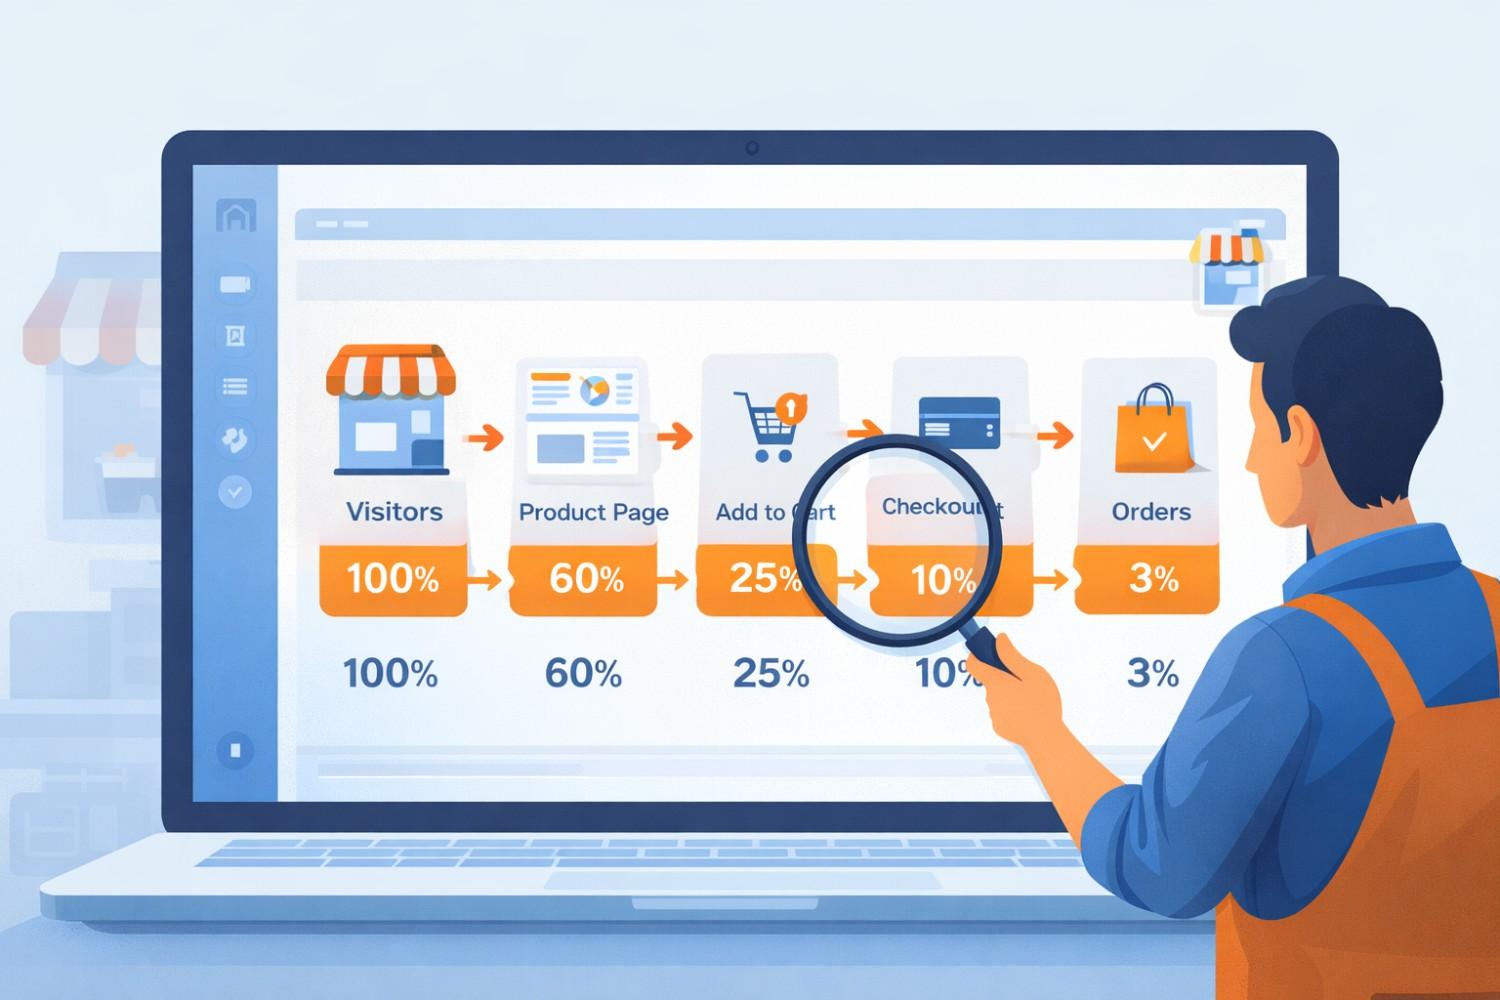
Analytics helps you see where people drop out of this journey.
For example:
100 visitors open your website.
60 view product pages.
25 add a product to the cart.
10 reach checkout.
5 complete the purchase.
This means most visitors drop off between cart and checkout.
Now you know where the problem is.
Maybe the shipping cost appears too late.
Maybe the checkout process feels complicated.
Without analytics, you would never see this clearly.
A simple example of improving conversion rates
Let us imagine a small seller from Jaipur selling handmade leather wallets.
Their website receives 1000 visitors per month.
But only 10 orders happen.
This means the conversion rate is:
10 ÷ 1000 × 100 = 1 percent
After checking analytics, the seller notices something interesting.
Most visitors leave the product page within 10 seconds.
This suggests a problem.
The seller improves three things:
- adds better product photos
- explains leather quality clearly
- adds delivery timeline and return policy
Within a few weeks, the numbers change.
Now the store gets 30 orders from 1000 visitors.
Conversion rate becomes 3 percent.
Traffic did not increase.
But clarity improved conversions.
Common problems that reduce conversion rates
Many ecommerce websites lose customers because of simple issues.
Some of the most common problems include:
Slow website speed.
Confusing product descriptions.
Poor product photos.
Hidden delivery charges.
Long checkout forms.
Trust is another major factor.
Indian customers are especially cautious with new websites.
Displaying things like:
- clear return policy
- customer reviews
- payment options like UPI or COD
can increase buyer confidence.
Why product pages matter the most
Product pages are where buying decisions happen.
Visitors usually decide within 10 to 20 seconds whether they trust a product page.
A strong product page usually includes:
clear product images
simple product description
price visibility
delivery information
customer reviews
Let us say you sell copper water bottles.
A weak description might say:
“premium copper bottle for health benefits”
But a stronger description could say:
“This copper bottle is suitable for daily drinking water at home or office. Copper bottles are commonly used in traditional Indian wellness practices. The bottle is durable, reusable, and easy to carry.”
This gives clarity to the buyer.
Clarity increases conversions.
Why mobile experience matters in India
In India today, most ecommerce traffic comes from mobile phones.
According to Statista digital commerce data (2024), over 70 percent of ecommerce traffic in India comes from mobile devices.
This means your store must work smoothly on mobile.
Small issues like:
buttons being too small
checkout forms being hard to fill
slow loading images
can significantly reduce conversion rates.
Always test your store on a phone.
If something feels difficult, customers will likely leave.
Small improvements that increase conversions
Improving conversion rates rarely requires big changes.
Often, small improvements make a big difference.
For example:
better product photos increase trust.
shorter checkout forms reduce frustration.
clear delivery timelines remove uncertainty.
showing stock availability creates urgency.
Imagine a product page that says:
“only 5 items left in stock”
This simple message can encourage faster buying decisions.
These small adjustments gradually improve your store’s performance.
Why analytics brings clarity for sellers
Many new ecommerce sellers feel overwhelmed by digital marketing advice.
There are endless tips online.
Run ads.
Improve seo.
Post on social media.
But analytics brings clarity.
It shows you what is actually happening on your website.
Instead of guessing, you can make decisions based on real visitor behaviour.
If a page has high traffic but low sales, you know something on that page needs improvement.
If visitors leave during checkout, the checkout process needs attention.
This clarity helps small businesses improve step by step.
Conclusion
Running an ecommerce store is not only about getting traffic.
It is about turning visitors into customers.
This is where conversion rates become an essential metric.
Even a small improvement in conversion rate can significantly increase revenue.
For example:
A store with 1000 visitors and 1 percent conversion gets 10 orders.
But improving to 3 percent conversion means 30 orders.
The traffic stayed the same, but sales tripled.
This is why understanding visitor behaviour through simple analytics is powerful.
Watch how people move through your website.
Identify where they lose interest.
Then improve those pages with clearer information, better product presentation, and smoother checkout.
Over time, these improvements build a store that not only attracts visitors but also converts them into customers.
References
Shopify ecommerce benchmark report
Google consumer insights research
Statista ecommerce market data
IRP commerce industry report

.png)